META

META is a powerful, intuitive CAE post-processing tool that works seamlessly with the leading finite element analysis solvers. Its superior graphics performance and broad range of innovative features complement ANSA to provide a complete pre- and post-processing environment.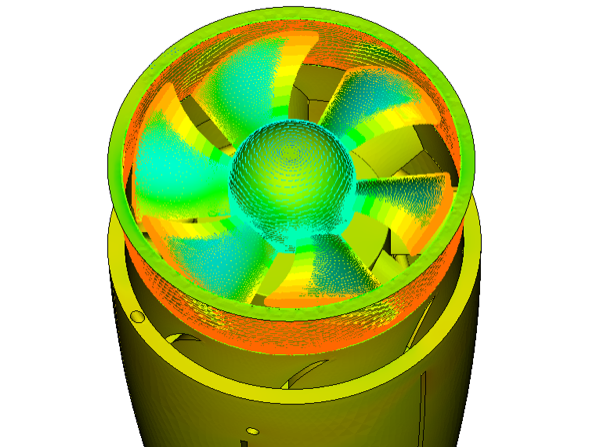
Support Results
Key to META’s ability to process results is its support for a multitude of formats from all mainstream solvers used in structural and CFD analyses. It also supports many neutral formats, as well as the ability to build custom readers.
Loading of 3D or 2D data is handled through dedicated interfaces which are flexible in allowing only the required data into META, allowing much larger datasets to be loaded for comparisons.
User Interface
A fully customizable interface allows the User increased flexibility in setting up their post processing environment. From the initial layout window options at start up, to the ability to add custom menus and interfaces for quick access to critical functionality, the META environment significantly reduces the time taken to perform basic and complicated post processing tasks.
The multi-window environment allows the User to interact with data a myriad of ways, from synchronizing 3D model results to 2D plot and video correlation.
3D field post-processing
 META offers faster animation of models with faster loading and generation of states. Filtering options in states allows the user to pin-point the exact state/load case that the user is interested in without spending time to find the load case of interest. States can be interpolated and locked to allow the animation of a particular state in focus. The animation speed can be controlled to make the animation slower or faster. The user can superimpose the non – deformed shape on the deformed to understand the mode shape/deformation.
2D plot post-processing
In addition to 3D contour plots, META provides a complete 2D plotting tool. Integrated in the same environment, multiple windows can be utilized to view many plots at once. 2D Plot windows can also be synchronized with 3D animations, allowing simultaneous visualization of both data sets.
Support for summary or time history files from their respective solvers allows quick loading of responses into the plot tool without the need to load 3D data.
 Curves can be processed with a multitude of filters for various disciplines, or Users can define mathematical expressions to generate the desired responses. The resulting data can be exported as images or directly as table data to Excel. Users can also define
Visualization Tools
Additional visualization tools are available which provide more visualization insight for specific disciplines.
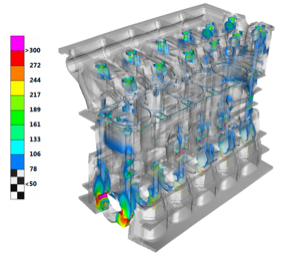
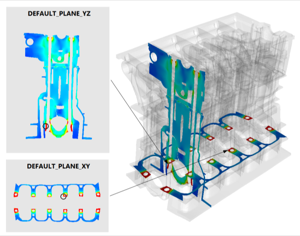 The Cut Planes tool allows clipping planes to visualize the interior of the model or observe the behavior at the cross section.
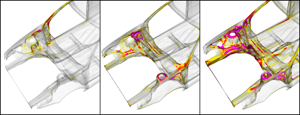
Iso-contours can be applied to shells and solids to provide insight into regions for a specific result value.
The Part statistics reports detailed information regarding the selected model and the current state. The user can filter and focus on specific parts or results.
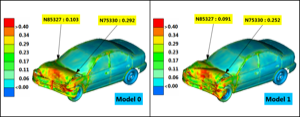
 To compare multiple models, the Multi model state statistics provides a summary table of results on Parts (or any entity), for every state and every model.
META provides an efficient way to create and manage streamlines for CFD analysis. From ribbon or cylindrical streamlines with defined twists, these streamlines can be edited interactively with controls to modulate them based on result sets. META can also use these streamlines to visualize Oil Flow paths on selected parts of the model.
Other tools such as the multiple clipping-plane-cuts with its advanced functionality, the explode feature with the numerous options for parts and models and the section force calculator provide the means for a closer insight into the results. Furthermore, a camera tool ensures the accurate management of the perspective view of the model.
Calculations on field Results
META allows the creation of User defined states, either through a linear combination of results or through any mathematical operation on loaded results.
The Linear Combination tool allows for using data from multiple files or models to create individual states for respective load curves with minimal user interaction.
 The Section Forces tool can be used to calculate the Section force at any section based on the original results.
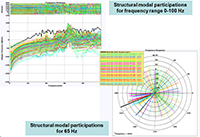
Modal Frequency Response and Modal Transient Response for a particular node of the model can be calculated inside META, given the normal mode results from NASTRAN and the dynamic loads.
Additionally, the user can also create the acoustic coupling between the structure and cavity or import it from the Nastran or Akusmod file.
Advanced filtering and Communication of results
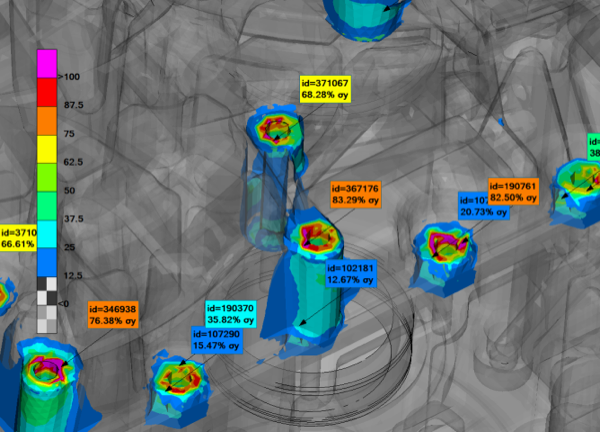 Once results are read in, it is important to quickly identify and filter the regions of interest for a particular load case. META offers both interactive tools to interrogate the results, and advanced filters which can be accessed through several tools to identify and report the critical regions in a single step.
The annotation tool can highlight the locations of critical areas while also reporting the values in a report friendly manner.
Output Options
Of critical importance in post-processing, is the ability to communicate through data, images or videos the results of the processing. META supports many of the standard image and video formats, and provide many utilities to specify the properties of the exported image files.
META also exports geometry data in the solver format for the communication of deformed states for use in pre-processing.
A database format is also provided which stores all geometry and results, as well as all action performed upon the results to return the User to the existing state. This can be used to convert results from any supported format to a reduced size META database.
Automation
META provides multiple utilities to help the analyst automate their processes. These include Session files, Scripting and Plugins. All these can be implemented through the customizable User Toolbar, which allows the User to build a custom interface to input data and execute queries.
Session Files can be used to automate complete post-processing operations. These files can be created by just recording steps interactively or can be created using a built-in META Session Editor. The editor provides a complete syntax checking and debugging functionality.
META Scripting is also available utilizing both the BETA Scripting and Python languages. Scripting provides the User access to core functionality inside the program not available at the interface, allowing further customization and automation.
Correlation Studies using Images & Videos
 A number of specially developed embedded tools are available to significantly simplify correlation studies between simulation results and physical test data. Using these tools, the exact and effortless matching of the model’s perspective view with that of an image can be achieved and the synchronization of the animation simulation with a test video can be set. Additionally, features can be traced on videos and the tracking results can be plotted automatically in a 2D plot.
Reporting
Many of the tools inside META provide report out capabilities. These can be included in the embedded report composer, which allows the User to compile all such data, including images, and videos into a PPTX, HTML or PDF file. Utilizing the ActiveX plugin provided for Microsoft Office, the User can also embed the META Database into a PPTX file for interactive visualization during the presentation.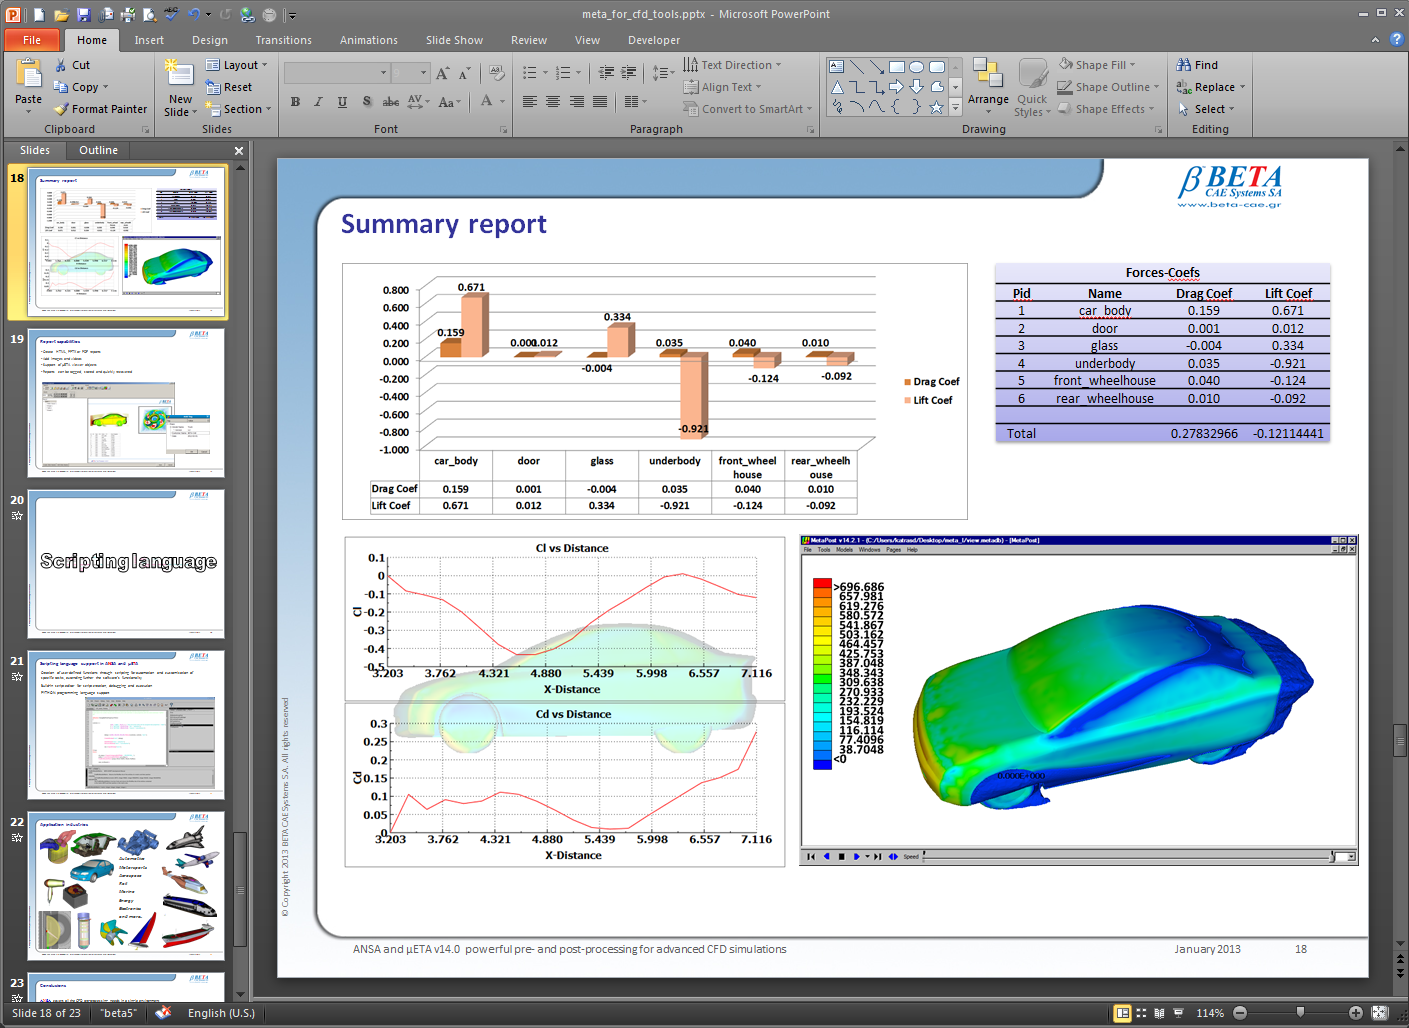
All these steps can be done manually or automatically through the use of scripts and session capabilities.